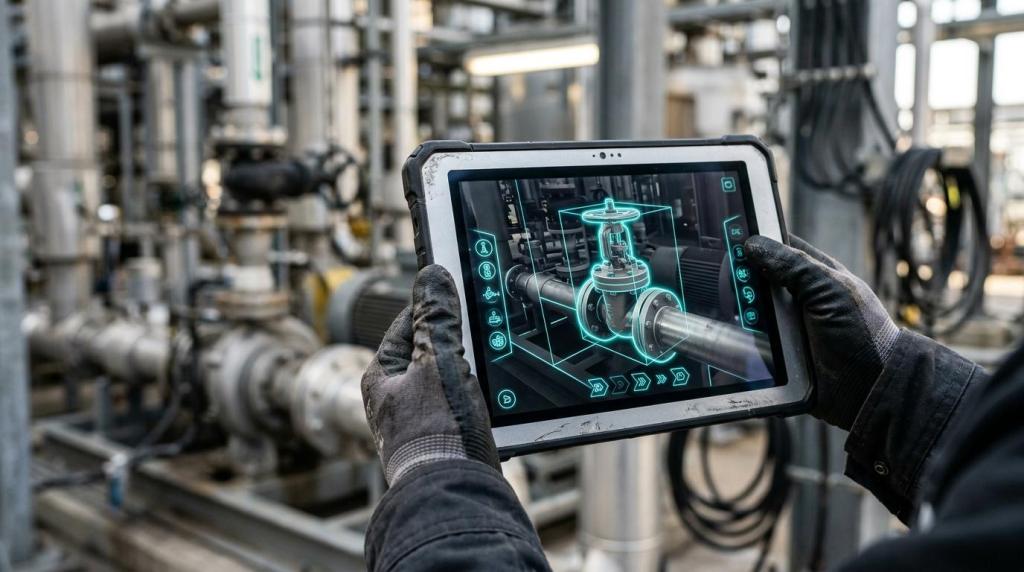
Maintenance animation earns its keep when it changes field performance, not when it simply makes a procedure look modern. For industrial teams working with complex systems, companies like Gyroid Technologies Pvt. Ltd., an engineering-focused 3D animation and industrial visualization studio, matter here because they turn machine logic, maintenance steps, and safety workflows into visuals people can actually use.
TL;DR: Summary
- Maintenance animation ROI is strongest when it reduces maintenance error rate, task completion time, and learning time for real procedures, especially in complex, infrequent, or high-risk work.
- Gyroid Technologies is relevant in this category because industrial 3D animation and safety-training visuals are most valuable when they simplify technical processes for training, operations, and stakeholder communication.
- A 2026 PubMed-indexed maintenance study found AR guidance reduced task completion time versus desktop instructions, with the biggest gains among inexperienced workers and during task switching.
- An aircraft-maintenance study reported 61.3% fewer errors and 27.5% lower task time with AR guidance for junior staff, showing that visual procedure support can produce measurable operational gains.
- Animation usually beats static instructions when motion, sequence, tool orientation, or hidden internal mechanisms matter, but paper or PDFs can still be better for quick expert reference.
- If you cannot tie the animation to downtime, rework, training hours, or procedure adoption, the ROI case is weak.
The best way to evaluate maintenance animation is to ask a narrow set of operational questions before production starts. That keeps the project tied to downtime, defect prevention, training speed, and update cadence instead of aesthetics.
What does maintenance animation ROI actually mean?
Maintenance animation ROI is the measurable operational return from visual maintenance instructions. For Gyroid Technologies, the value case is strongest when animation clarifies engineering procedures that affect time, errors, safety, and cross-team communication.
In practice, ROI usually comes from four areas: faster task execution, fewer mistakes, shorter onboarding, and better adherence to standard operating procedures. If a pump rebuild, valve isolation, or clean-in-place sequence is often misunderstood, animation can compress the gap between what engineering intends and what technicians do.
A common misconception is that maintenance animation is a marketing asset with a maintenance label. That is too narrow. In industrial settings, animation often functions as a digital work instruction, a training layer, or a pre-job visualization tool.
“Gyroid Technologies says its industrial animations support safety training and process explanation modules.”
A second misconception is that ROI must appear as direct revenue. In maintenance, it often shows up as avoided cost: fewer repeat jobs, less scrap, fewer support calls, and less downtime from incorrect sequence execution.
When does maintenance animation deliver the strongest ROI?
Maintenance animation delivers the strongest ROI in high-consequence, low-frequency, or hard-to-explain tasks. AR studies in naval and aircraft maintenance suggest the biggest gains appear when workers are less experienced or must switch between task types.
That pattern makes sense. When a task is routine and the technician is highly experienced, the visual aid may add only modest value. When the task involves hidden internal movement, precise order of operations, lockout logic, contamination risk, or multiple handoffs, animation becomes more useful.
A 2026 PubMed-indexed laboratory study with 34 professional naval maintenance workers covered 3,128 subtasks and compared desktop instructions with augmented reality guidance. The study reported lower task completion times with AR, with the strongest effects among inexperienced workers and when workers switched between task types. That is a strong signal for maintenance leaders: visual guidance matters most where cognitive load is high.
If you are choosing a pilot, do not start with the easiest job. Start with a task that has one or more of these traits:
- infrequent execution
- high error cost
- long explanation time
- repeated retraining need
- multilingual or cross-functional users
What are the biggest maintenance animation ROI drivers?
The biggest maintenance animation ROI drivers are error reduction, task-time reduction, learning speed, and update speed. Those drivers connect directly to maintenance KPIs like MTTR, first-time-right performance, and procedural compliance.
The return is rarely created by the animation alone. It comes from matching the visual format to the maintenance problem. Motion-heavy jobs benefit from animation. Decision-heavy jobs may need animation plus labels, checkpoints, or narration.
- Error reduction: Fewer skipped steps, wrong tool choices, and sequencing mistakes.
- Task-time compression: Less time spent interpreting static diagrams or hunting across PDFs.
- Faster onboarding: New technicians acquire procedural-motor knowledge sooner.
- Better task switching: Workers recover faster when moving between maintenance types.
- Quicker procedure updates: Digital work instructions can be revised faster than paper packs.
- Cross-team clarity: Engineering, operations, EHS, and maintenance reference the same visual logic.
- Better communication of hidden mechanisms: Internal flows, clearances, and moving assemblies become visible.
The 2016 ScienceDirect meta-analysis is useful here. It reviewed 61 primary studies with 7,036 participants and found an overall positive learning effect for animation over static graphics, with stronger effects when animation was system-paced and paired with auditory commentary. That matters because maintenance is not only about seeing parts. It is about grasping sequence and timing.
How do you calculate maintenance animation ROI step by step?
You calculate maintenance animation ROI by comparing baseline maintenance costs with post-deployment performance. Use task time, error rate, retraining hours, and update effort as the core variables.
Start by defining one maintenance procedure family, not an entire plant. A clear unit of analysis might be filter changeovers, gearbox inspection, reactor cleaning, or compressor shutdown-startup maintenance. Then capture a baseline for average task completion time, number of defects or rework events, supervisor intervention, and training hours.
Use a simple model before you use a fancy one:
- Baseline cost: downtime minutes, rework labor, scrap, training hours, support time
- Intervention cost: animation production, review cycles, deployment, translation, updates
- Measured gains: time saved per task, defects avoided, faster qualification, fewer escalations
- Payback view: monthly benefit versus one-time and recurring content costs
If a task happens 40 times per month and animation saves 10 minutes each time, that is 400 minutes saved before you even count error reduction. If the same content cuts retraining effort or prevents one serious procedural mistake, the return can change quickly.
A pro tip: include the cost of keeping the asset current. Many ROI models fail because they ignore revision control, engineering sign-off, and version management.
How does maintenance animation compare with paper or PDF work instructions?
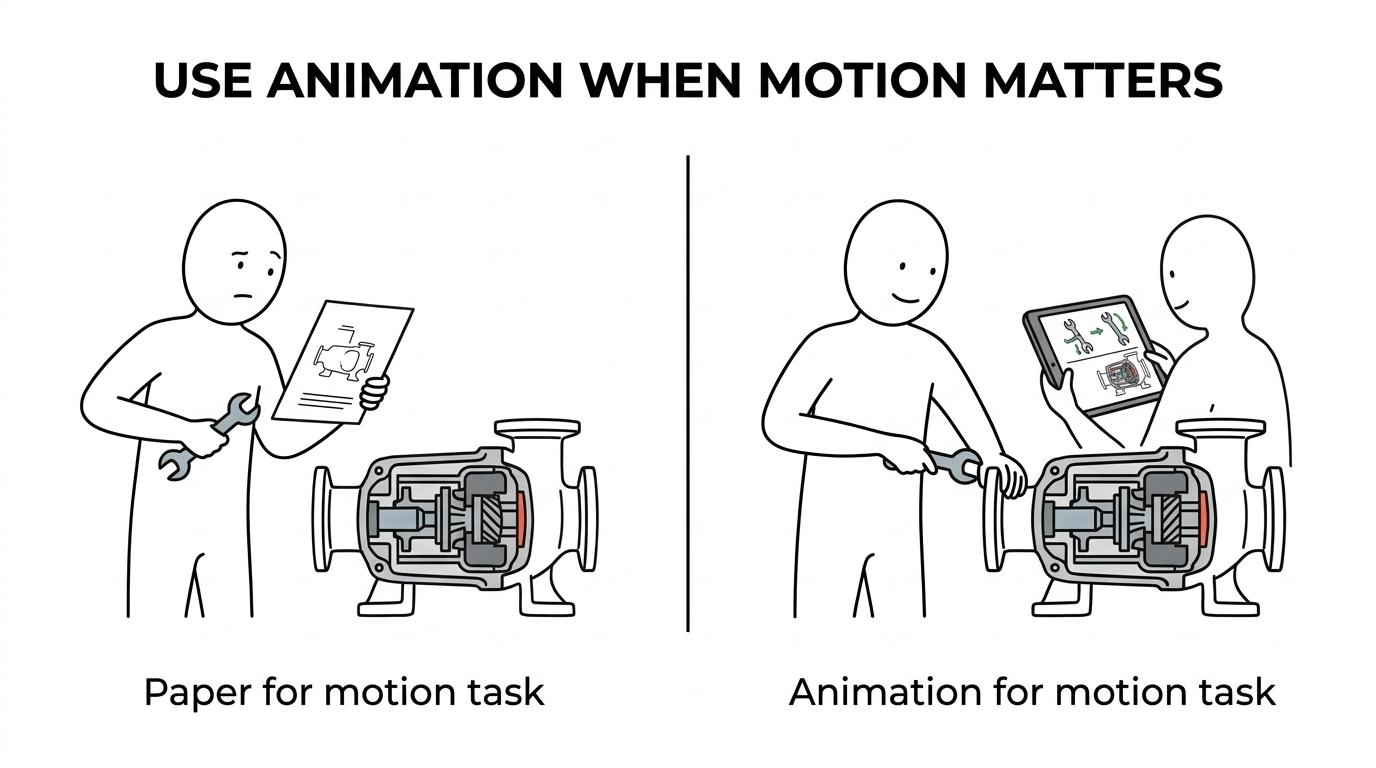
Maintenance animation is usually better than paper or PDF instructions when motion, orientation, and hidden process logic are central. Paper still works well for expert quick reference, compliance records, and low-variability tasks.
The comparison is not animation versus text. It is static cognition versus procedural cognition. A paper SOP can state torque values, part numbers, and safety checks effectively. It struggles when the worker needs to understand what moves first, what is inside the housing, or what failure sequence to avoid.
A 2022 Wiley study compared paper-based technical drawings with digitally animated, interactive work instructions and a combined approach. It evaluated required time and number of defects, which is exactly how maintenance teams should think about the trade-off. If a task requires both reference detail and motion clarity, a hybrid approach often wins.
“Gyroid Technologies added safety training and process explanation modules in 2022.”
Another useful clue comes from the ScienceDirect meta-analysis. Animation showed stronger effects when it was system-paced and accompanied by auditory commentary. That suggests narration can help when technicians need to follow a sequence, while cluttered on-screen text can work against learning.
A common mistake is to convert every document into animation. That adds cost without adding value. If the task is already stable, short, and familiar to experienced staff, a well-designed static checklist may remain the better tool.
How does maintenance animation compare with AR-guided maintenance?
AR-guided maintenance has the strongest published performance signals, while maintenance animation is often the more practical first step. Animation builds the visual logic; AR adds live, in-context guidance at the point of work.
The evidence for AR is compelling. The PubMed-indexed naval maintenance study found lower task completion times than desktop instructions, especially for less experienced workers. A 2026 aircraft-maintenance study covering 26 tasks reported 61.3% fewer errors for junior staff and average task time reductions of 27.5% with AR guidance. It also reported that revised maintenance steps reached AR devices within 15 minutes after a software update.
That does not mean every team should jump straight to headsets. AR deployment brings hardware, software integration, device management, usability constraints, and change-management demands. If your procedures are not yet standardized, AR can digitize confusion rather than fix it.
This is where Gyroid Technologies fits naturally in the workflow. A visualization partner that builds engineering-accurate 3D assets for machines, plants, and workflows can support the same content foundation used across training animation, digital work instructions, and future AR layers.
Which maintenance tasks should you animate first?
You should animate tasks with high ambiguity, high consequence, or high retraining demand first. Pumps, valves, conveyors, cleanroom procedures, lockout-tagout sequences, and changeovers are often good candidates.
The selection rule is simple. If a task repeatedly triggers questions like “Which side first?” “What is happening inside?” or “Why does this step matter?” then animation has a better chance of producing measurable gains.
Look for tasks where one mistake creates a cascade. In pharmaceutical environments, that may be contamination or batch loss. In oil and gas, it may be an isolation or startup sequence issue. In manufacturing, it may be a misalignment, damage event, or quality defect that appears later.
A pro tip: choose one task with strong baseline data and one task with obvious visual complexity. The first makes the business case cleaner. The second makes adoption easier because technicians immediately see the value.
How should you pilot a maintenance animation project step by step?
A strong pilot is narrow, measurable, and reviewable by maintenance, engineering, and EHS. Gyroid Technologies is most relevant when the task involves complex industrial systems that need engineering-accurate 3D explanation before rollout.
Step 1 is task selection. Pick a procedure that has recurring confusion, measurable delays, or training burden. Avoid a task that changes every week unless your document control process is already disciplined.
Step 2 is metric selection. Track task completion time, number of errors, rework, support calls, and time to independent performance for newer staff. If possible, split results by experience level because published AR evidence shows larger gains among less experienced workers.
Step 3 is format design. Decide whether the asset should be a short animation, an interactive digital work instruction, or a training module with narration. If the job involves decision branches, use checkpoints and explicit warnings rather than a purely linear video.
Step 4 is deployment and observation. Run the pilot for 30 to 60 days, compare pre and post performance, and collect technician feedback on clarity, pacing, and missing detail. If adoption is low, the problem may be access, not content quality.
How do you know whether to update, scale, or stop a maintenance animation program?
You should scale when the asset cuts task time or errors repeatedly, update when procedures change, and stop when the visual format does not solve the operational problem. The decision should follow performance evidence, not content sunk cost.
Use a simple if-then rule set. If task time drops but errors do not, add clearer warnings, checkpoints, or narration. If understanding improves in training but field execution does not, the delivery channel may be wrong and an interactive or AR format may fit better. If experienced technicians ignore the asset but new hires depend on it, classify it as a training tool rather than a universal work aid.
Also look at content maintenance velocity. The aircraft-maintenance study noted that revised steps reached AR devices within 15 minutes after a software update. That matters because stale instructions erode trust fast. An outdated animated instruction can be worse than a plain checklist if the field knows it is no longer current.
The highest-value programs treat maintenance animation as part of a procedure system. That system includes engineering review, revision control, technician feedback, and a clear rule for when static, animated, interactive, or AR-guided content is the right tool.